Background of the Project
This is a challenge at DataCamp set out to test business intelligence skills on a real-world dataset focusing on supply chain analytics.
The case assumed me as the main data analyst for Just In Time, where I am tasked to help solve key shipment and inventory management challenges, analyze supply chain inefficiencies, and create insightful dashboards to inform business stakeholders about potential problems and propose structural business improvements.
Click here to download the datasets used and the data dictionary. (just in case you want to replicate the work). Just open the sidebar, click on files, then data, and download the 3 datasets: orders_and_shipment, fulfillment, & inventory. The notebook/workspace will show all the column descriptions as well.
Data Overview and Preparation
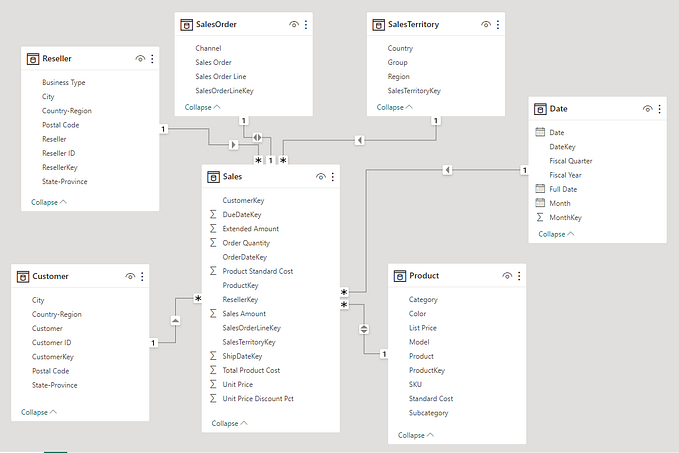
There are 3 datasets provided: orders_and_shipment, fulfillment, and inventory. The image below is a data model I built in Power BI which shows the contents of each dataset.

Data cleaning process began with an exploratory to check the consistency of each column with the data dictionary in Microsoft Excel and I spotted that some orders have shipment dates happening before the order dates which seems incorrect.
I addressed this inconsistency with the IF function to return the order_date + scheduled dates in such scenarios rather than deleting the columns. Another option could be data swapping.
The other steps taken loading the data into Power BI using the Power Query Editor; where I created some columns needed to support the analysis, such as:
- Shipment Intervals = Shipment_date — Order_date
- Net Revenue = Gross_sales - (Gross_Sales * Discount)
- InventoryValue = WarehouseInventory * InventoryCostPerUnit
In Power BI, I used the fulfillment table as a bridge table to connect the DAX to connect the orders_and_shipment and inventory tables, so that I can pull out some calculated columns. Below are some of the DAX Functions used to create calculated columns and measures.
// DAX for Meassures
% of Delayed Orders =
DIVIDE(
       COUNTROWS(FILTER(orders, orders[DeliveryStatus]="delayed")),
       COUNTROWS(orders)
)

AvgDelayedDays = AVERAGEX(
    FILTER(orders, orders[DeliveryStatus] = "delayed"),
    orders[DeliveryDay])

Net Profit = SUM(orders[ Profit ])
Net Revenue = SUM(orders[Revenue])
TotalOrders = COUNTROWS(orders)
TotalQuantity = SUM(orders[OrderQuantity])
// DAX for Calculated Columns
Total Quantity Ordered =
CALCULATE(
SUM('orders'[OrderQuantity]),
ALLEXCEPT('fulfillment', 'fulfillment'[ProductName])
)
Total Inventory Value =
CALCULATE(
SUM(inventory[InventoryValue]),
ALLEXCEPT(fulfillment,fulfillment[ProductName])
)
Supply-Demand Ratio =
DIVIDE('fulfillment'[Total Inventory Value],
'fulfillment'[Total Quantity Ordered])
Stock Status =
IF('fulfillment'[Supply-Demand Ratio] > 1, "Overstock",
IF('fulfillment'[Supply-Demand Ratio] < 1, "Understock", "Balanced"))
DeliveryStatus =
IF(orders[DeliveryDay] > orders[ ShipmentDays-Scheduled ],
"Delayed",
"On-Time")Data Analysis and Insights:
Interact with the dashboard here: Click here
Out of the 30,871 total orders, 43.54% of orders were delayed in both warehouses with an average of 49 days delay time. Most delayed orders were orders with first-class shipment mode which is supposed to be the most efficient.
This pattern is the same for both warehouses with average delay days of 42 and 60 days in the USA and Puerto Rico warehouses respectively.
Over the years the order delay rate has been dropping at a very slow pace but needs an urgent permanent solution as the no of orders has significantly dropped.
Around 82% of the products are overstocked in the warehouse which in turn affects efficiency and increases inventory cost.
Recommendation:
The company can consider warehouses to supply close customer markets and locations rather than shipping to far places.
The scheduled timeline for other orders for each shipment mode can be reviewed to provide more precise expected dates rather than giving a false hope that can’t be met to ensure customers’ loyalty.
Orders that are mostly ordered in particular locations and times of the year can be investigated to make the warehouse work more efficiently.
Power BI Dashboard Interaction
You can interact with the dashboard by clicking this link below:


Thank you fo reading.
You can connect with me on Twitter: @bayonle_j


