Customers Behaviour Analysis with SQL and Power BI: Google Capstone Project

Dear Readers! In this article, I will be sharing how I leverage data analytics to understand how Cylistic Bikes customers use the company’s bikes differently. Let’s go! (Feel free to replicate and contact me)
This work has been broken down into several sections to allow easy interaction and readability.
- Project Overview
- Data Exploration and Cleaning
- Analysis and Insights
- Recommendations
I also visualized my findings in a PowerBI dashboard here: See Dashboard
Project Overview
Cyclistic is a bike-share program that features nearly 6,000 bicycles and more than 600 docking stations. One benefit of the program was the flexibility of its pricing plans, where consumers can buy access to Divvy bikes using these options: (1) Single-ride passes for $3 per 30-minute trip; (2) Full-day passes for $15 per day for unlimited three-hour rides in a 24-hour period; and (3) Annual memberships for $99 per year for unlimited 45-minute rides. This allowed customer segmentation into:
Casual riders: single-ride and full-day passes subscribers
Cyclistic members: full-year subscribers
The Director of Marketing for the Chicago area’s bike-share program understood the company’s future success depended on a focused approach to marketing that maximized the number of annual memberships. She then set out to understand: “How do members and casual riders use Divvy bikes differently?” with the objective of converting casual riders to members.
This project is curated as one of the Google Professional Data Analytics Certificate Capstone Project. Read more about it here.
Data Exploration
The dataset about customers’ rides was downloaded at: click here under this license. Data from Jan to Dec 2022 were downloaded and each of them contains similar columns:

Data Cleaning with Microsoft Excel Macro
In each month's dataset, I started by dropping columns where ended_at is not greater than the started_at: I created a new column with =E2>D2, then removed the rows that are FALSE for the argument.
Then, I also remove some columns that I feel won’t be needed in the analysis (start_station_id,end_station_id, latitude, and longitude details).
I also ensure the text columns (station_names, )are trimmed to avoid white spaces. Then the member_casual and rideable_type columns were renamed to bike_type and user_type respectively.
I then joined the Jan, Feb, and Mar as Q1 with Power Query Editor but other quarters are too large to join.
Database setup and Analysis with PostgreSQL
NB: The full documentation of my SQL queries is in my GitHub repo: here
I started by setting up the database for the data and then imported the data using GUI in Postgres.
-- created database with GUI and then proceed with the table
-- to create the tables Q1 to dec (I just input table_name in the xxx)
DROP TABLE IF EXISTS xxx;
CREATE TABLE xxx (ride_id VARCHAR(100),
                  bike_type VARCHAR(50),
                  started_at TIMESTAMP,
                  ended_at TIMESTAMP,
                  start_station_name VARCHAR(250),
                  end_station_name VARCHAR(250),
                  user_type VARCHAR(50));

-- this is used to create other quarters
CREATE TABLE q** AS (SELECT * FROM <month_name> UNION ALL
                    SELECT * FROM <month_name> UNION ALL
                    SELECT * FROM <month_name>)

--merging all quarters to a single table
CREATE TABLE full_year AS (SELECT * FROM q1 UNION
                            SELECT * FROM q2 UNION
                            SELECT * FROM q3 UNION
                            SELECT * FROM q4)
-- drop months column since it's already in quarters
DROP TABLE IF EXISTS apr,may,jun,jul,aug,oct,sep,oct,nov,dec

SELECT * FROM full_year -- to preview the data

-- data exploration was carried out
SELECT COUNT(DISTINCT ride_id) FROM full_year -- all rides
SELECT COUNT(*)
Creating a View
Ride lengths less than 5mins are considered test rides, and rides without start or end station names are dropped. This was achieved with VIEW.
-- creating a cleaned table with view
DROP VIEW IF EXISTS divyride;
CREATE VIEW divyride AS (SELECT *, (ended_at - started_at) AS ride_length
       FROM full_year
       WHERE end_station_name IS NOT NULL AND
             start_station_name IS NOT NULL AND
             (ended_at - started_at) >= '00:05:00')
Quick EDA
I performed a quick exploratory analysis to have a sense of what the data looked like.
-- EDA (Exploratory Data Analysis)
SELECT user_type,
       MAX(ride_length),
       MIN(ride_length),
       AVG(ride_length),
       COUNT(*) AS no_of_rides
FROM divyride
GROUP BY user_type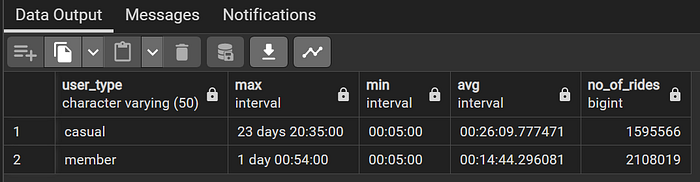
No. of rides completed by each user type
Casual riders have 1,595,566 rides (43.08%) while members have 2,108,019 rides (56.92%).
WITH t1 AS (SELECT user_type, COUNT(*) AS no_of_users
     FROM divyride
     GROUP BY user_type),
     t2 AS (SELECT SUM(no_of_users) AS total_users
     FROM t1)
SELECT t1.*,
       ROUND((no_of_users/total_users)*100,2) AS User_Percentage
FROM t1,t2;
How do the users use different bike types?
For both categories, classic bikes are the most used, followed by electric bikes. But no member ever used docked bike.
SELECT bike_type,
       user_type,
       COUNT(*) AS no_of_bikes_used
FROM divyride
GROUP BY bike_type, user_type
ORDER BY user_type, no_of_bikes_used DESC;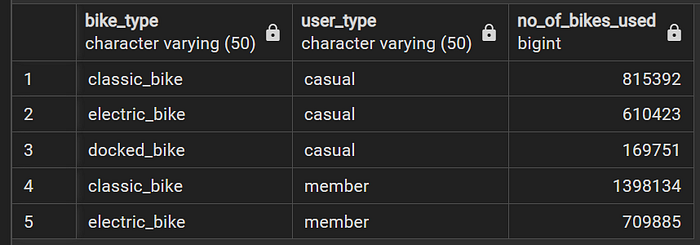
No_of_rides in each quarter by user_type
There is a similar pattern in the number of rides by quarter, with the highest in Q3 then Q2, Q4, and the least in Q1 for both user types.
SELECT user_type,
       'Q'||EXTRACT(QUARTER FROM started_at) AS quarter,
       COUNT(*) AS no_of_rides
FROM divyride
GROUP BY quarter, user_type
ORDER BY user_type, no_of_rides DESC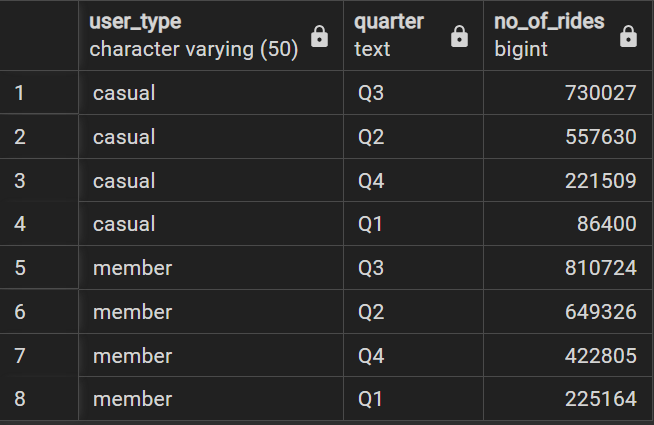
Riding patterns and avg ride_length per day by user_type
Casual customers ride more during weekends, and members have more rides during weekdays and less during weekends.
SELECT CASE EXTRACT(dow FROM started_at)
            WHEN 0 THEN 'Sunday'   WHEN 1 THEN 'Monday'
            WHEN 2 THEN 'Tuesday'  WHEN 3 THEN 'Wednesday'
            WHEN 4 THEN 'Thursday' WHEN 5 THEN 'Friday'
            WHEN 6 THEN 'Saturday'
            END AS day_of_week,
       COUNT(*) AS no_of_rides,
       AVG(ended_at - started_at) AS avg_ride_length
FROM divyride
WHERE user_type = 'member'
GROUP BY day_of_week
ORDER BY no_of_rides DESC
Top 5 stations where most rides are initiated by user_type
WITH starting AS(
   SELECT start_station_name,
   CASE WHEN user_type = 'member'
     THEN DENSE_RANK() OVER (PARTITION BY user_type ORDER BY COUNT(*) DESC)
     WHEN user_type = 'casual'
     THEN DENSE_RANK() OVER (PARTITION BY user_type ORDER BY COUNT(*) DESC)
     END AS ranking
   FROM divyride
   GROUP BY start_station_name, user_type
   ORDER BY user_type, ranking )

SELECT * FROM starting
WHERE ranking <= 5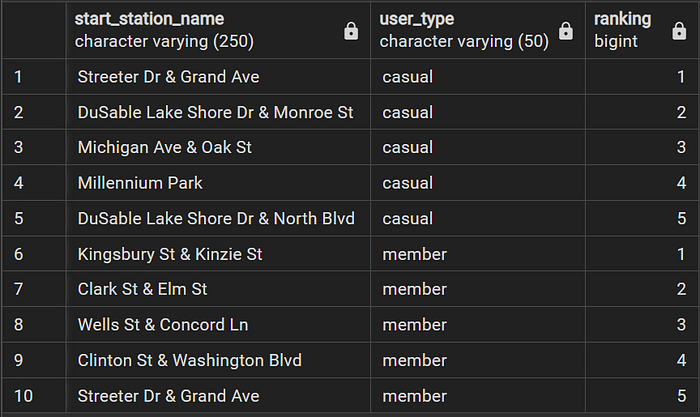
Top 5 destinations by user_type
WITH destination AS (
    SELECT end_station_name, user_type,
    CASE WHEN user_type = 'member'
    THEN DENSE_RANK() OVER (PARTITION BY user_type ORDER BY COUNT(*) DESC)
    WHEN user_type = 'casual'
    THEN DENSE_RANK() OVER (PARTITION BY user_type ORDER BY COUNT(*) DESC)
    END AS ranking
    FROM divyride
    GROUP BY end_station_name, user_type
    ORDER BY user_type, ranking )

SELECT * FROM destination
WHERE ranking <= 5 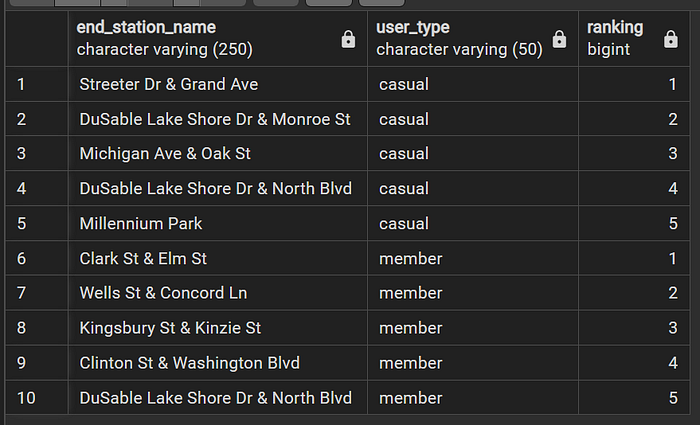
Recommendations:
a. Weekends are best-suited days for campaign runs and advert as many of the casual members are seen during these days. Also, promotional content can be increased in the 3rd Quarter to get good reach.
b. In the context of the top 5 originating station locales, it is advisable to initiate promotional endeavors that are closely tied to geographical specifics. Notably, a substantial proportion of these locales are recognized as prominent tourist hubs.
To optimize the outreach of marketing initiatives, a strategic alliance with businesses pertinent to the tourism sector is recommended. This collaboration could be harnessed to facilitate the dissemination of promotional content to a broader tourist demographic.
By leveraging such partnerships, the marketing campaign stands to effectively engage a greater number of tourists, enticing them with more enticing offers at a reduced cost, thus enhancing its overall impact.
